A mere 1% improvement in pricing can lead to an 11% increase in operating profits. Yet most SaaS companies are unsure if their pricing is right.
Pricing is not just about covering costs. It reflects the value your product delivers to users and directly influences revenue and growth. The Van Westendorp Price Sensitivity Model (PSM) is a powerful market research technique that helps you find the sweet spot for your pricing by asking customers about their perceptions of value and price.
Most software companies leave 20-30% of potential revenue on the table due to suboptimal pricing. That is the entire profession of pricing in one line: get pricing wrong, and you lose money and market share — get it right, and you unlock sustainable growth.
Four critical price points define your pricing boundaries
Van Westendorp’s model is built on four simple but revealing questions you ask your target customers:
| Price Point | Question to Ask | What It Means |
|---|---|---|
| Too Cheap | At what price would you consider the product too cheap to be good quality? | Lower price bound (risk of cheap perception) |
| Bargain | At what price would you consider the product a bargain? | Optimal lower price (good value perception) |
| Getting Expensive | At what price would you say the product is getting expensive? | Optimal upper price (maximum willingness to pay) |
| Too Expensive | At what price would you not consider buying because it’s too expensive? | Upper price bound (market shrinks beyond this) |
These questions reveal how customers trade off price and value. Plotting the cumulative responses as curves on a chart shows where these price points intersect — revealing your acceptable price range and optimal price point.
How to interpret the curves and intersections
The model plots four curves, each representing one of the questions above as a cumulative frequency distribution over price points. The key intersections are:
- Point of Marginal Cheapness (PMC): Where the "Too Cheap" and "Bargain" curves cross. Prices below this risk the product being perceived as low quality.
- Point of Marginal Expensiveness (PME): Where the "Too Expensive" and "Getting Expensive" curves cross. Prices above this sharply reduce the market size.
- Optimal Price Point (OPP): Where the "Bargain" and "Getting Expensive" curves cross. This is the price most customers see as fair value — your pricing sweet spot.
- Indifference Price Point (IPP): Where "Too Cheap" and "Too Expensive" curves cross. The price where equal numbers think it is too cheap or too expensive.
The acceptable price range lies between PMC and PME, and you should price near the OPP.
Real-world example: Project management software pricing
Imagine you surveyed customers for a project management SaaS tool with monthly subscription pricing:
# Sample price points from market research (₹ per month)
too_cheap = [500, 800, 1000, 1200, 1500]
bargain = [1500, 2000, 2500, 3000, 3500]
getting_expensive = [4000, 4500, 5000, 5500, 6000]
too_expensive = [7000, 8000, 9000, 10000, 12000]

# Key intersections found:
optimal_lower = 2500  # PMC
optimal_upper = 4500  # PME
optimal_price = 3500  # OPP
- The acceptable range is ₹2,500 to ₹4,500 per month.
- The optimal price is around ₹3,500 per month.
- Pricing below ₹1,500 risks customers thinking the product is low quality.
- Pricing above ₹7,000 drastically reduces your market.
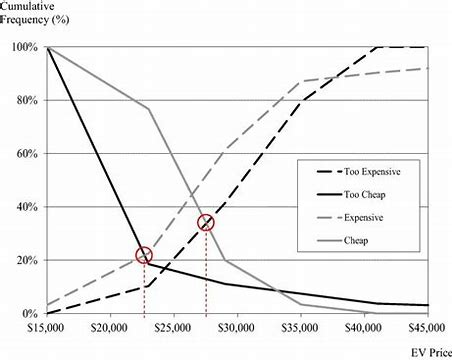
This visualization helps you justify your pricing decisions with customer data, not guesswork.
MeetingScene: Discussing Van Westendorp results with the leadership team
Product strategy meeting at a SaaS startup in Bangalore
CEO: “The sales team wants to raise prices to ₹5,000 per month. Is that justified?”
Product Manager: “Based on our Van Westendorp survey, ₹3,500 is the optimal price point where most customers see value. ₹5,000 is above the optimal range and risks losing price-sensitive segments.”
Sales Lead: “But won’t a higher price increase revenue per customer?”
Product Manager: “Yes, but it will also shrink the market. Pricing above ₹4,500 crosses the point of marginal expensiveness. We risk losing many potential customers.”
CEO: “So we should price near ₹3,500 and focus on increasing adoption?”
Product Manager: “Exactly. We can test this with A/B pricing experiments in different segments.”
The team aligns on a data-driven pricing strategy, balancing revenue and market size.
Balancing higher prices with market acceptance
How to apply Van Westendorp in software products
Pricing software is complex because customers differ widely in willingness to pay and value perception. Here are practical tips:
- Segment your audience. Enterprise customers, SMBs, and individual users have different price sensitivities. Run Van Westendorp surveys separately for each.
- Use feature-based tiers. Map pricing tiers to feature sets within the acceptable range. For example, basic plans near the lower bound, premium plans near the upper bound.
- Consider competitor pricing. Overlay competitor prices to understand market positioning and avoid surprises.
- Factor in cost structure and margins. Your pricing must cover costs and desired margins while staying within customer acceptable ranges.
- Test with A/B experiments. Validate assumptions by testing different prices in the market and measuring conversion and churn.
SlackChat: Pricing team discussing segmentation
Common pitfalls to avoid
Van Westendorp is powerful but not a silver bullet. Avoid these mistakes:
- Don't rely solely on Van Westendorp. Combine it with competitive analysis, cost-based pricing, and usage data.
- Avoid hypothetical features in surveys. Ask about actual products or well-defined concepts customers understand.
- Do not ignore regional and cultural price sensitivity differences. India’s vast market has wide income and preference diversity.
- Reassess pricing regularly. Markets evolve, new competitors emerge, and customer expectations shift.
- Beware of overfitting to survey data. Use it as guidance, not gospel.
FieldExercise title="Run a Van Westendorp survey for your product" time="20 min"
- Define your product or feature clearly and describe it in simple terms.
- Identify your target customer segments (enterprise, SMB, individual).
- Prepare the four Van Westendorp questions tailored to your product.
- Collect at least 30 responses per segment via surveys or interviews.
- Plot cumulative frequency curves for each question.
- Identify PMC, PME, OPP, and IPP intersections.
- Write down the acceptable price range and optimal price point for each segment.
- Reflect on how this matches your current pricing and where adjustments are needed.
JudgmentExercise
scenario="You are the PM for a SaaS HR management tool targeting SMBs in Mumbai. Your current plan charges ₹3,000/month. You have Van Westendorp survey data showing: PMC at ₹2,000, PME at ₹4,000, and OPP at ₹3,200. Competitors charge ₹2,500-₹3,500. Your CFO wants to raise prices to ₹4,500 citing margin pressure." question="What is your recommendation on pricing, and how do you communicate it to leadership?" expertReasoning="Raising prices to ₹4,500 exceeds the point of marginal expensiveness and risks losing customers. The acceptable price range tops at ₹4,000, and the optimal price is ₹3,200. Recommend pricing near ₹3,200-₹3,500 to balance revenue and retention. Communicate that pricing above ₹4,000 will shrink the market and likely reduce overall revenue. Suggest alternative margin improvements via cost optimization or upselling." commonMistake="Ignoring customer price sensitivity and competitor prices, and pushing for a price hike that alienates the market. This often leads to churn and revenue loss." />
You are the PM for a SaaS HR management tool targeting SMBs in Mumbai. Your current plan charges ₹3,000/month. You have Van Westendorp survey data showing: PMC at ₹2,000, PME at ₹4,000, and OPP at ₹3,200. Competitors charge ₹2,500-₹3,500. Your CFO wants to raise prices to ₹4,500 citing margin pressure.
Your task: What is your recommendation on pricing, and how do you communicate it to leadership?
your reasoning:
FromTheField context="from a Pragmatic Leaders pricing workshop"
I have seen many Indian SaaS startups struggle with pricing because they guess or copy competitors blindly. One founder told me, "We set prices based on what the sales team says customers complain about." That approach left 25% revenue on the table.
Van Westendorp gives you a structured way to hear the customer's voice on price. But the model works only if you segment properly and combine it with competitive and cost data.
The startups that use Van Westendorp well segment their customers, tailor pricing tiers, and run A/B tests. That discipline creates clarity and confidence in pricing decisions.
Where to go next
- Understand broader pricing strategies: Pricing Strategies — Mastering the Art & Science of Value Capture
- Learn to design customer surveys: User Research Methods
- Explore pricing experiments: A/B Testing for Pricing
- Dive deeper into SaaS monetization: SaaS Business Models